A microservice architecture supported by containerized applications underlies many cloud-native technologies. Not only do they offer scalability and flexibility, but they also ensure that applications are packaged with all the resources they require.
Kubernetes is the industry's de facto solution for container management. While deployment via Kubernetes is simplified, thanks to its out-of-the-box features, it's still a constant challenge to track the cost of the resultant infrastructure.
This blog post will examine why cost monitoring in Kubernetes cost monitoring is such a challenge. We’ll then compare some of the common cost observability tools available in today’s market.
The Challenges of Kubernetes Cost Monitoring & Observability
The challenges of K8’s cost observability can be divided into the following four groups:
-
Allocation of total costs: To provide a scalable and flexible environment to run applications, K8s proactively creates, supports, and dumps container instances as needed. Thus, its resource usage is highly volatile, making it a challenge to track the actual usage levels and distribute overhead expenses.
-
Abstraction of Kubernetes: The Kubernetes API creates a cloud-native and modern abstraction layer between the infrastructure and end-user applications. You create namespaces, deployments, and StatefulSets in Kubernetes. Under the hood, Kubernetes creates pods on servers, and provisions load balancers and volumes. Tracking the cost of these components requires a solution capable of tracking these abstraction layers provided by Kubernetes (from pods to namespaces).
-
Multi-cloud landscapes: Kubernetes can run on any public cloud provider or on-premises system — or apply a hybrid approach. Therefore, it is possible to have different bills from different service providers for your clusters.
-
Savings insights and opportunities: When deploying applications, you can request resources such as CPU and memory. However, you also need to identify to what extent those requested resources are actually used to minimize waste. Since Kubernetes and its infrastructure are very volatile, such calculations and checks should be automatic.
There are some excellent tools on the market to help you overcome these challenges. Next, we will consider what they should offer and how well these cost observability solutions meet these needs.
State-of-the-Art Kubernetes Cost Monitoring & Observability Tools
Kubernetes does not come with an out-of-the-box cost observability tool. However, there are tools on the market to help you understand and calculate the costs of your applications running in the cloud. In this section, we will focus on the top five trending cost observability tools, paying special attention to the following criteria:
-
Installation: Cost observability tools should be easy to install and manage. But, they must do so with minimal intrusion on the cluster itself to limit performance / security concerns.
-
Configuration difficulty: Configuration is critical for Kubernetes cost monitoring and cloud provider monitoring. A faulty configuration results in mistaken calculations and estimations.
-
Cost visibility (per pod/deployment/namespace): One of the critical characteristics of cost observability is the ability to accurately calculate the costs per pod, pod-label, deployment, namespace, and other resources in your cluster.
-
Connection to external billing (such as AWS billing data): Your Kubernetes monitoring tool should connect to your cloud provider’s billing system. Your AWS bill, for example, has cost information that is essential to accurate Kubernetes costings.
-
Open-source and community: Kubernetes is an open-source platform with an active community, and its popularity stems from this. Check the license and the community of the tools you are using.
The Most Popular Cost Observability Tools
1. Finout
Finout is the ultimate FinOps solution. With a straightforward configuration and installation, it integrates with your Prometheus database using Finout’s open-source cronjob or with your Datadog account API. Either approach provides access to your Kubernetes cluster metrics (CPU and memory).
Once integrated, Finout has access to cost per pod, deployment, namespace, cron job, StatefuSet, and cluster; it uses these metrics to enrich your AWS Billing data with granular cost visibility. Once this level of cost visibility is achieved, the problem of allocating cost per customer/tenant/dev team/business application is solved. Using Finout, the user can quickly and accurately report, via a simple and intuitive platform, which K8s and AWS components each business unit is composed of and their costs – just as if Amazon sent you the bill.
2. Kubernetes Dashboard
Kubernetes Dashboard is an open-source, general-purpose web UI for Kubernetes clusters. It is part of the official Kubernetes landscape, so its configuration and installation are straightforward. With Kubernetes Dashboard, you can check what is running in your cluster and see its distribution to your worker nodes. However, the dashboard does not provide any information about cost visibility, such as price per pod or deployment. In addition, you cannot connect the dashboard to any external billing system, such as AWS Billing, for data collection or enrichment.
3. Prometheus
Prometheus is today’s leading open-source monitoring framework that provides out-of-the-box monitoring capabilities for Kubernetes. However, it is not easy to install or configure for monitoring your applications running in the cluster. Configured properly, Prometheus can collect CPU, memory, and storage metrics from all your pods and nodes – in addition to Kubernetes-specific metrics. However, it lacks the cost visibility for Kubernetes resources and a connection to external billing systems.
4. The ELK Stack
The ELK Stack is a collection of three popular open-source tools: Elasticsearch, Logstash, and Kibana. The stack provides a central location to collect, analyze, and view logs of applications running in the cluster. Because of this, it is a valuable option for diagnosing and troubleshooting the problems of distributed applications. However, it is difficult to install and configure, and lacks a connection to external billing systems or cost visibility over Kubernetes resources.
5. KubeCost
KubeCost is a cost monitoring and management tool that focuses on cost visibility and cost control. KubeCost’s free offering is an open-source solution with basic configuration and installation into the cluster. It helps reveal the actual price of your Kubernetes resources, such as pods or deployments. However, you cannot connect it directly to your cloud cost observatory tool external billing systems, such as AWS billing. In order to enrich and consolidate data, you need to connect your billing data to an AWS Athena database. In addition, most of its major capabilities are locked behind a paywall.
Conclusion
In summary, the tools discussed offer the following features:
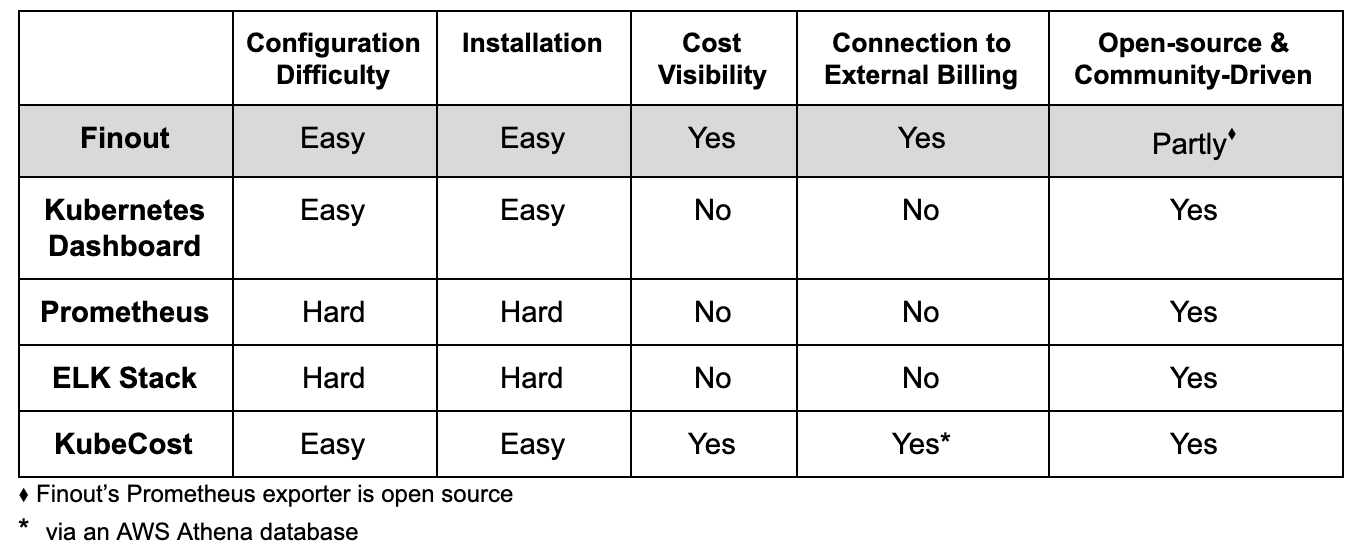
Finout's toolset provides a robust Kubernetes cost monitoring platform that outperforms other available solutions. With this solution, Finout empowers any modern, growing company to retain full visibility over its cloud costs to ensure effective FinOps, of course including K8s.
